
How to read the tape on futures
The chart tells you where price went. The tape tells you how it got there: who paid up, who sat and took it, and who walked away. This guide shows what to watch and where the reading fails.
What the tape actually is
The tape is the record of every execution in a contract, in order: time, price and size. A print at the offer means a buyer crossed the spread; a print at the bid means a seller did. Beside it, the ladder lists the orders still waiting.
One is a record of what happened. The other is a list of intentions that can vanish at any moment. Tape reading is the comparison between the two: pressure against response.
Four behaviours worth naming
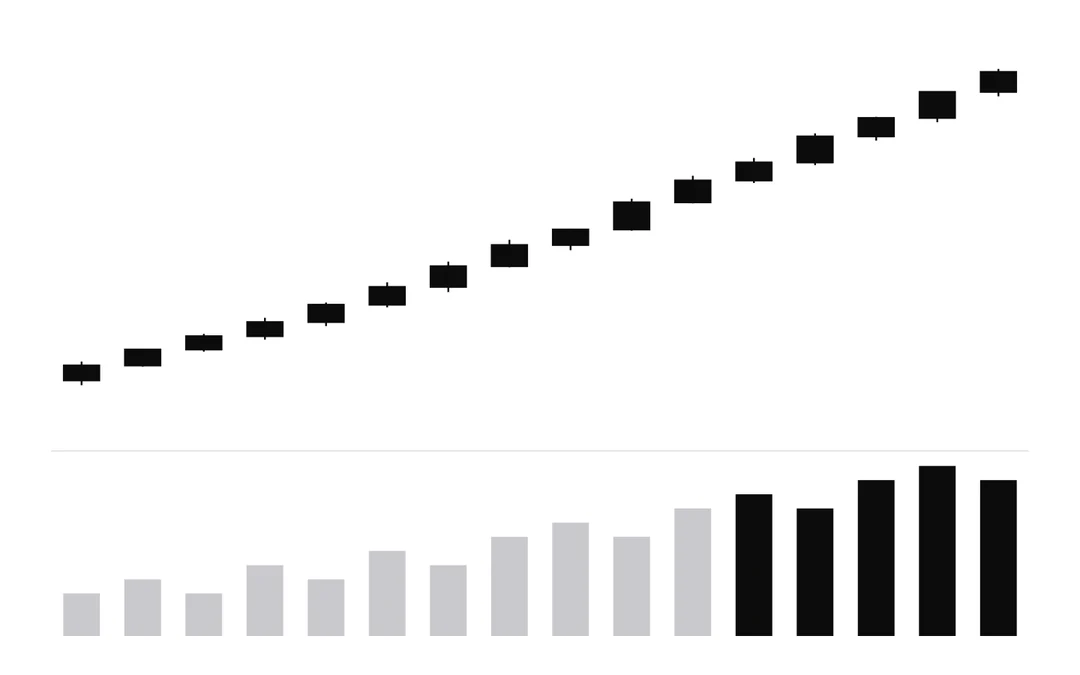
Aggression
Prints lift the offer, size grows and price walks up level by level. Pressure and response agree. It is the simplest read: do not stand in front of it.
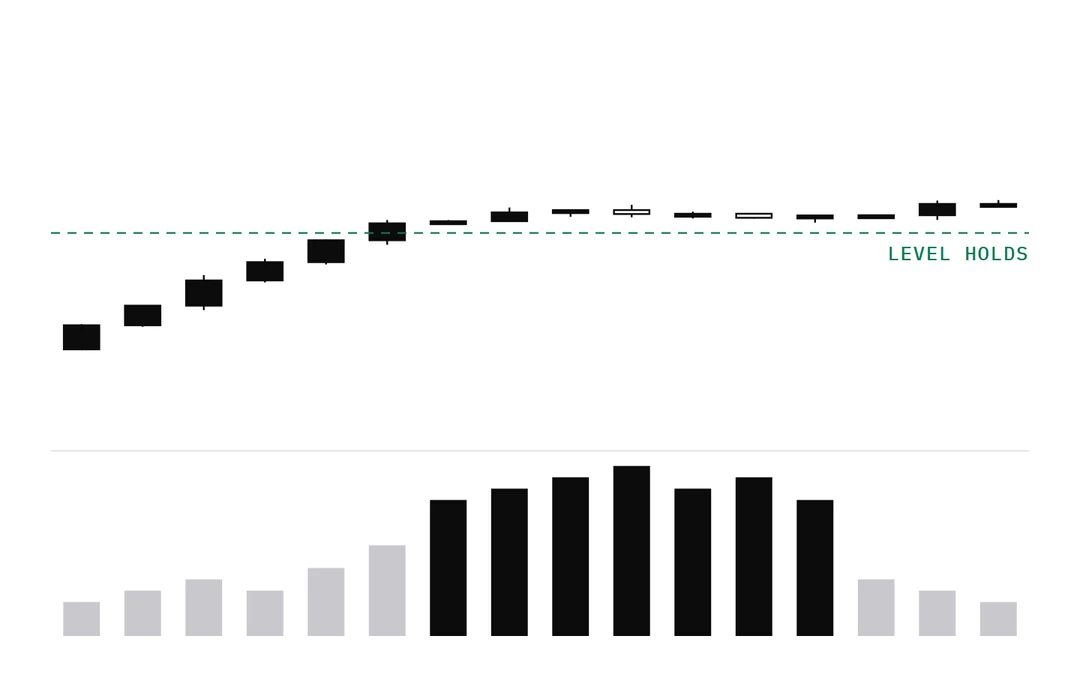
Absorption
Heavy selling into the bid, yet the level holds and price will not tick down. A passive buyer may be taking the other side. It can end either way: the buyer holds or gets run over.
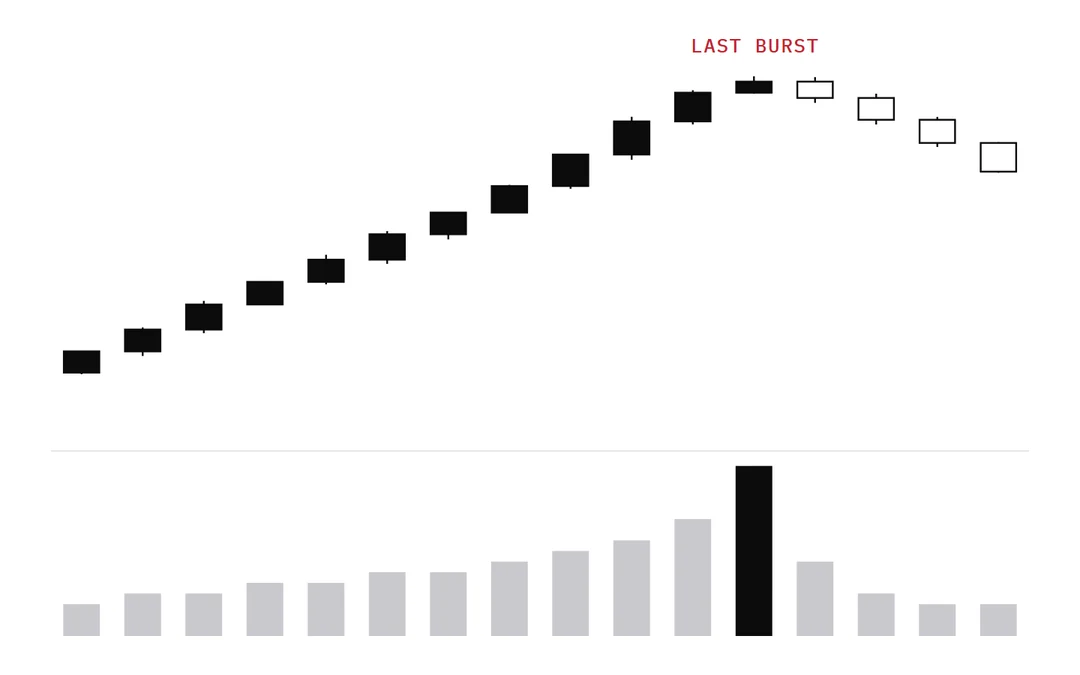
Exhaustion
The last big burst of a run: the largest prints, then no follow-through in the next bars. Late buyers are in and nobody is left to lift the next offer.
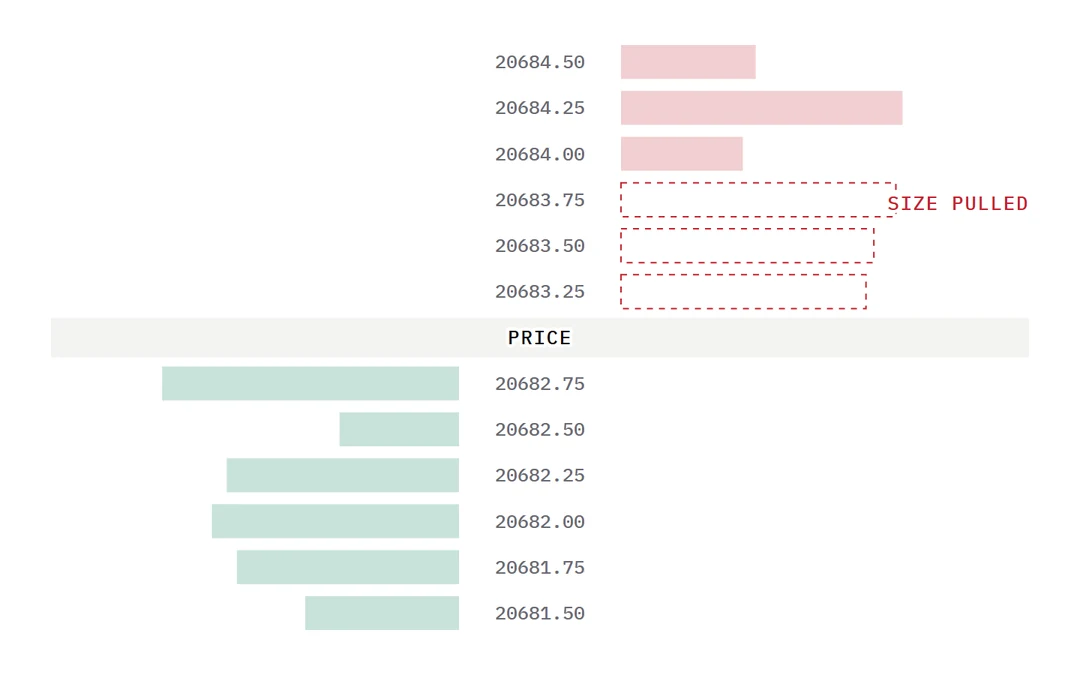
Pulled liquidity
Size on the ladder disappears as price approaches, with no prints to explain it. The wall was never going to trade, and price can slip through fast.
Why futures suit this work
A contract trades on one exchange book, so the record is complete. Spot forex has no single book, and its “volume” is only a count of price changes.
Even on futures, the contract is one part of the picture. ETFs, options and the cash market are linked to it, and they can move price for reasons your screen does not show.
A five-step routine
- Mark the level before the session. No level, no read.
- Note a normal minute: how many prints and what size, so unusual activity stands out.
- Wait for price to reach the level and watch the first reaction.
- Compare pressure with response: did the aggression move price?
- Set your invalidation and size before you click.
The Tape Kit
| Depth LadderPIPS DOM | A Level 2 ladder with Time & Sales and order entry in its own window. |
|---|---|
| Bid × Ask GridPIPS Footprint | Volume at every price, imbalances and the busiest price of each bar. |
| Big PrintsPIPS Big Trades | Large executed trades shown as bubbles sized by volume. |
| Running DeltaPIPS Cumulative Delta | The running gap between aggressive buying and selling. |
| Volume-Weighted LinePIPS VWAP | Session, weekly, monthly or anchored VWAP with deviation bands. |
Where the reading breaks
- Speed. In a fast market, prints arrive quicker than you can read them.
- Split orders. One large order can appear as dozens of small prints.
- Classification. Data feeds identify the aggressor differently, so numbers can differ between platforms.
- Hidden size. Iceberg orders show only part of their size.
- News. Around major releases, spreads widen and liquidity evaporates.
- Leverage. A small move can mean a large loss. Read the risk disclaimer before trading real money.
Common questions
How long does it take to learn tape reading?
There is no fixed timeline. Practise on session replay and log your reads until the same result repeats in real time.
Do I need Level 2 data?
For the ladder, yes. Time & Sales and the footprint use executed trades, and historical data needs Tick Replay.
Is tape reading suitable for beginners?
Start with clear levels, one contract and a simulation account. The tape does not replace a plan.
What is the difference between tape reading and order flow?
Order flow is the wider term for analysing trades and liquidity. Tape reading is its direct, moment-by-moment practice.
Educational content, not investment advice. Futures trading involves a risk of loss that can exceed the initial investment.